12 Best Heatmap Tools for Website Analytics & Optimization
Welcome to our blog! Today, we're diving into the fascinating world of heatmap tools. Whether you're an e-commerce business owner, a digital marketer, or a website designer, understanding how your users interact with your website is crucial. This is where heatmap tools come in.
Heatmap tools provide valuable insights into how website visitors navigate, engage, and interact with your web pages. By visualizing user behavior through color-coded heatmaps, you can quickly identify areas of high activity, popular content, and even potential roadblocks that hinder conversions.
But heatmap tools don't stop at visualizing data. They offer a range of powerful features, such as click tracking, scroll maps, and session recordings, that provide a comprehensive understanding of user behavior. Armed with these insights, you can optimize your website design, layout, and content to enhance user experience, increase conversions, and drive business growth.
In this blog series, we'll explore the top heatmap tools available, their features, and how they can benefit your business. So, buckle up and get ready to unlock the secrets hidden within your website's user data with heatmaps tools!
12 Best Heatmaps Tools You Must Know
-
Hotjar Heatmap
-
Crazy Egg Heatmap
-
Microsoft Clarity Heatmap
-
Zoho Pagesense Heatmap
-
SmartLook Heatmap
-
NotifyVisitors Heatmap
-
Lucky Orange Heatmap
-
Mouseflow Heatmap
-
Inspectlet Heatmap
-
VWO Heatmap
-
FigPii Heatmap
-
Browsee Heatmap
Hotjar Heatmap
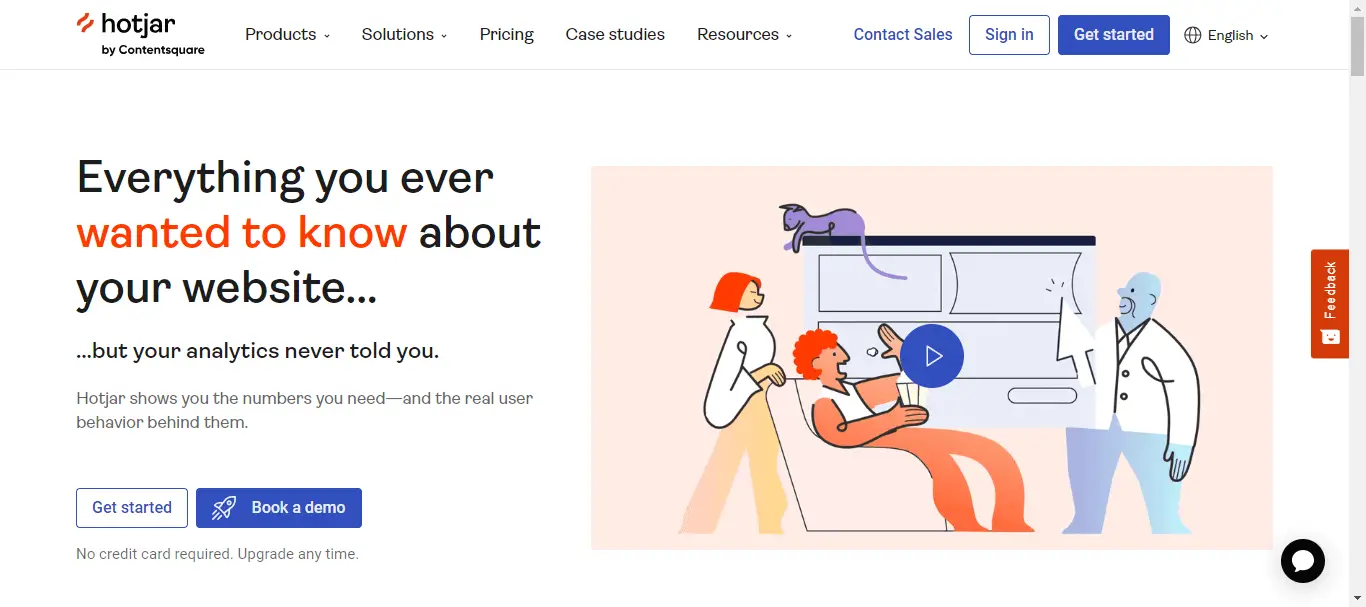
Hotjar Heatmap tool is a powerful resource that allows businesses to gain valuable insights into user behavior on their websites. This tool visually represents user activity by generating heatmaps that highlight areas of high and low engagement.
With Hotjar Heatmap, businesses can easily understand how visitors interact with their website, identify the most and least popular sections, and make data-driven decisions to optimize their online presence. By analyzing the heatmap, businesses can determine which elements attract the most attention, such as buttons, links, or images, and strategically place them for maximum impact.
The tool goes beyond basic analytics by providing visual representations of user behavior, making it easier for businesses to interpret data and spot patterns. The heatmaps can be segmented by device type, such as desktop or mobile, allowing businesses to optimize their website for different platforms.
Hotjar Heatmap tool is an essential asset for businesses looking to enhance user experience, increase conversions, and drive more engagement. By utilizing this tool, businesses can make informed decisions and create a website that truly resonates with their target audience.
List of features on the Hotjar Heatmap tool
- Click heatmaps
- Scroll heatmaps
- Move heatmaps
- Session recordings
- Conversion funnels
- Forms analysis
- Heatmap segmentation
- Heatmap integration
- Heatmap filters
- User segmentation options
- Custom heatmap creation tools
Crazy Egg Heatmap
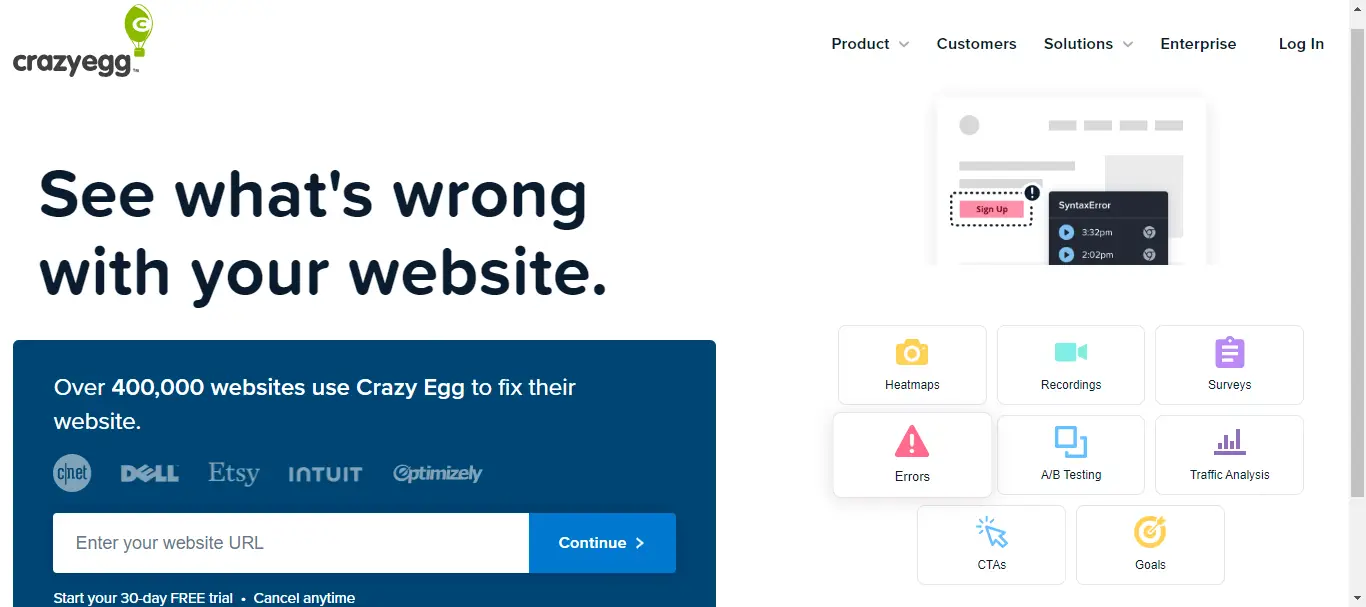
Crazy Egg Heatmap tool is a valuable resource for businesses looking to understand how users interact with their websites. It provides visual heatmaps that illustrate user behavior by highlighting areas of high and low engagement. By utilizing Crazy Egg, businesses can gain key insights into user behavior, such as where visitors are clicking, scrolling, or spending the most time.
One of the standout features of Crazy Egg Heatmap tool is its ability to segment data based on different variables, such as device type, traffic source, or user demographics. This allows businesses to tailor their website optimization efforts based on specific user segments, ensuring maximum impact.
In addition to heatmaps, Crazy Egg also offers other helpful tools like scroll maps, which highlight how far users scroll down the page, and confetti maps, which show individual clicks and the referral sources behind them. These features provide a comprehensive understanding of user behavior and enable businesses to make data-driven decisions to improve their website's performance.
Crazy Egg Heatmap tool is a must-have for businesses seeking to optimize their websites, increase engagement, and enhance user experience. With its intuitive visualizations and insightful data, it empowers businesses to make informed decisions and drive meaningful results.
List of key features of Crazy Egg heatmap tool
- Click Heatmaps
- Scroll Heatmaps
- Confetti Heatmaps
- User Snapshots
- A/B Testing
- Conversion Funnels
- User Recordings
- Session Replay
- Error Tracking
- Heatmap Segmentation
- Heatmap Integration
- Heatmap Filters
- User Segmentation Options
- Custom Heatmap Creation Tool
Microsoft Clarity Heatmap
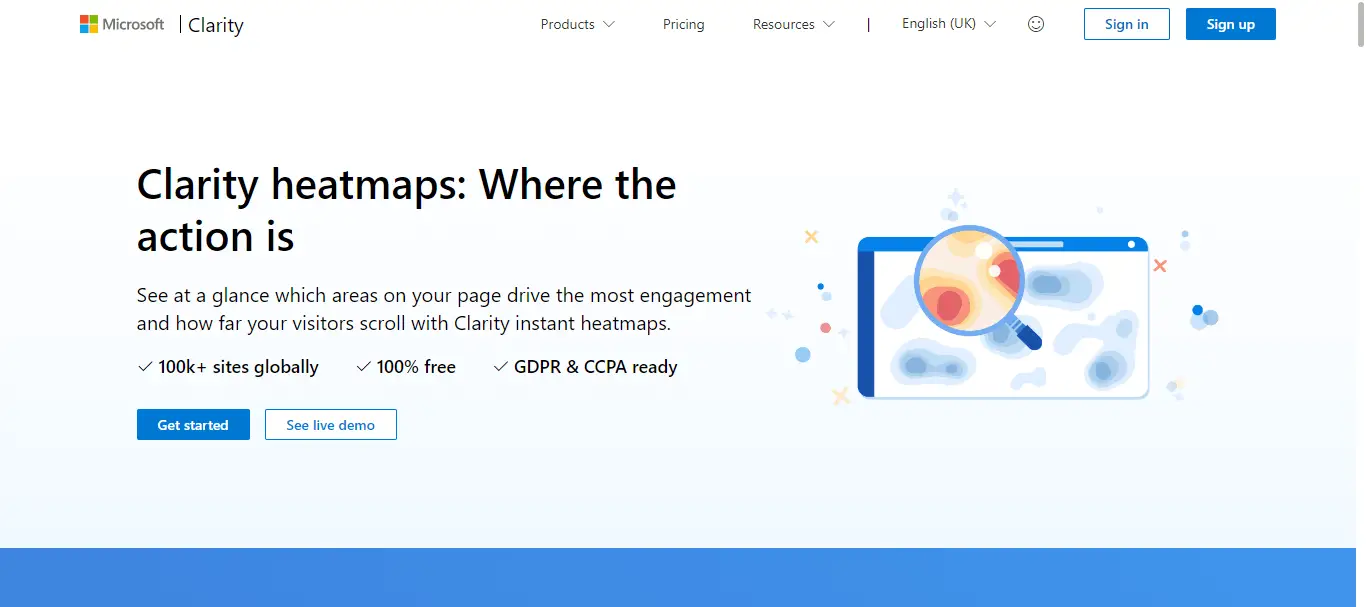
Microsoft Clarity Heatmap tool is a game-changer for businesses looking to gain a deeper understanding of user behavior on their websites. This powerful tool provides visual heatmaps that reveal how visitors interact with different elements of a webpage, helping businesses identify areas of high and low engagement. With Microsoft Clarity, businesses can easily see where users are clicking, scrolling, and spending the most time, enabling them to optimize their website for better user experience and increased conversions.
One of the standout features of the Microsoft Clarity Heatmap tool is its ability to segment data based on different variables, such as device type, browser, or traffic source. This allows businesses to analyze user behavior across various segments and tailor their website optimization efforts accordingly. Additionally, Microsoft Clarity provides session recordings that allow businesses to watch how users navigate their website, providing valuable insights into their browsing habits and pain points.
With its intuitive interface and powerful analytics, the Microsoft Clarity Heatmap tool is a valuable asset for businesses seeking to improve their website's performance. By gaining insights into user behavior, businesses can make data-driven decisions that lead to better user experiences, increased engagement, and ultimately, higher conversions.
Here is a List of features on the Microsoft Clarity heatmap tool
- Click heatmaps
- Scroll heatmaps
- Area heatmaps
- Taps heatmaps
- Dead taps
- Rage taps
- First tap
- Last tap
- Session recordings
- Insights
- Conversion maps
- User segmentation
- Integration with Google Analytics
Zoho Pagesense Heatmap
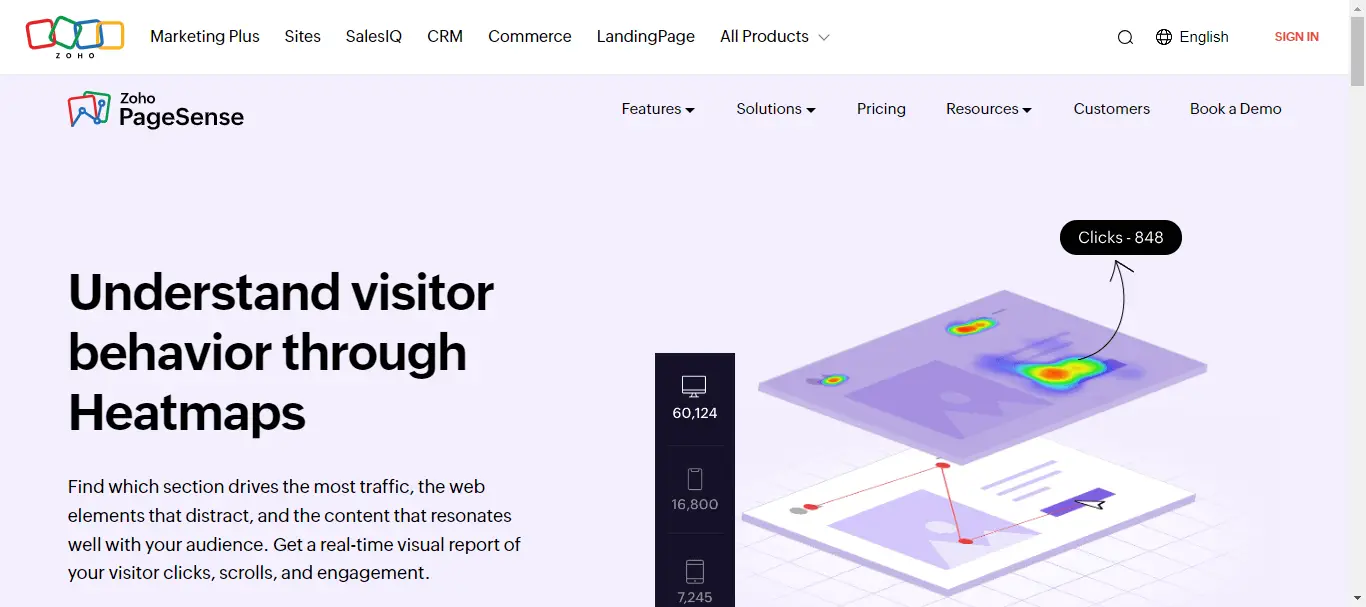
Zoho Pagesense Heatmap tool is a top-notch solution for businesses aiming to understand and optimize user experience on their websites. This tool offers visual heatmaps that provide valuable insights into user behavior by highlighting areas of high and low engagement.
With Zoho Pagesense, businesses can easily visualize where users are clicking, scrolling, and spending the most time, enabling them to make informed decisions to improve their website's performance.
One of the standout features of the Zoho Pagesense Heatmap tool is its ability to segment data based on various parameters, such as user demographics, traffic sources, or device types. This segmentation allows businesses to analyze user behavior for specific audience segments and tailor their website optimization strategies accordingly.
Additionally, Zoho Pagesense provides A/B testing capabilities, allowing businesses to experiment with different variations of their website and determine which one drives better user engagement and conversions.
With its user-friendly interface and robust analytics, the Zoho Pagesense Heatmap tool empowers businesses to understand their website visitors better. By utilizing the insights provided by Zoho Pagesense, businesses can make data-driven decisions to enhance user experience, increase engagement, and achieve their goals.
List of key features of the Zoho PageSense heatmap tool
- Click Heatmaps
- Scroll Heatmaps
- Attention Maps
- Session Recordings
- Funnel Reports
- Form Analytics
- Scroll Maps
- Consolidated Heatmaps
- Chrome Extension
- Advanced URL Targeting
SmartLook Heatmap
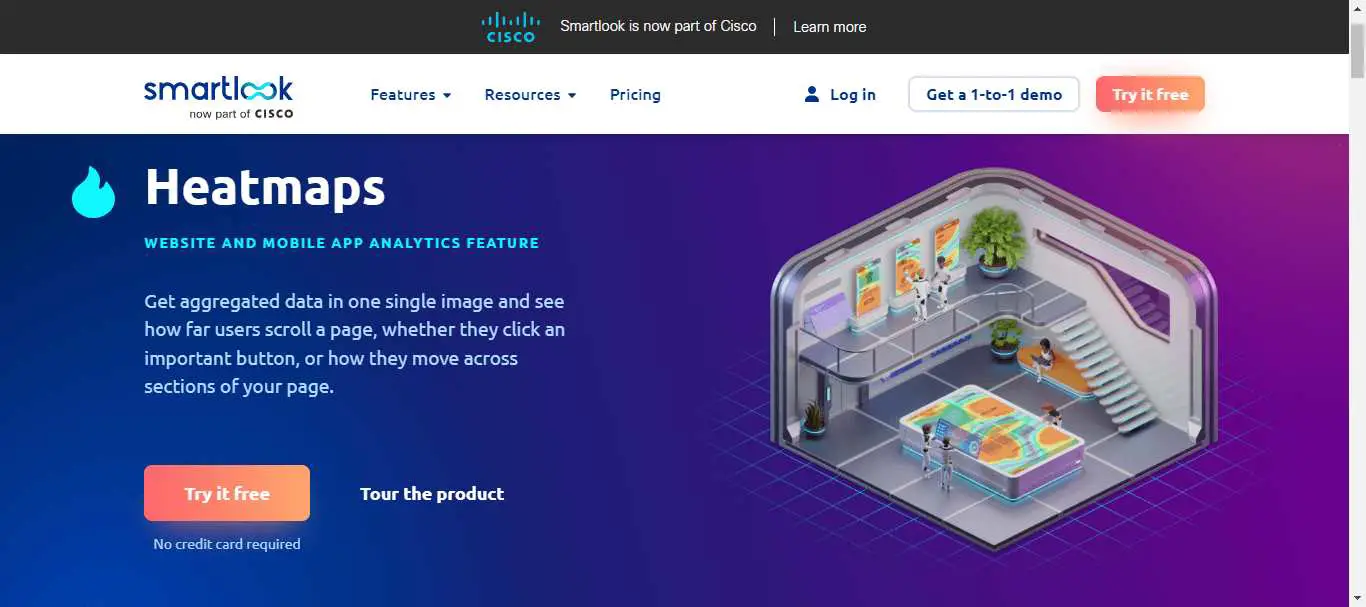
SmartLook Heatmap tool is an exceptional solution designed to help businesses gain valuable insights into user behavior on their websites. This tool provides a visual representation of user interactions by creating heatmaps that highlight the areas of highest and lowest engagement.
With SmartLook Heatmap, businesses can easily identify which elements on their website are attracting the most attention and optimize accordingly to enhance user experience and drive conversions.
One of the key features of SmartLook Heatmap tool is its ability to segment data based on various parameters such as traffic sources, device types, or user demographics. This segmentation allows businesses to analyze user behavior for specific audience segments and tailor their website optimization strategies accordingly.
Additionally, SmartLook offers real-time recordings of user sessions, enabling businesses to see exactly how users navigate and interact with their websites. This valuable feature helps businesses identify potential pain points or areas for improvement.
SmartLook Heatmap tool is user-friendly and provides businesses with actionable insights to make data-driven decisions. By utilizing the insights provided by SmartLook, businesses can optimize their websites, improve user experience, and ultimately achieve their business objectives.
List of features on SmartLook heatmap tool
- Click heatmaps
- Scroll heatmaps
- Move heatmaps
- Session recordings
- Event tracking
- Funnel analysis
- Retroactive heatmaps
- User segmentation
- Device-specific analysis
- Cross-platform functionality
- Customizable dashboards
NotifyVisitors Heatmap
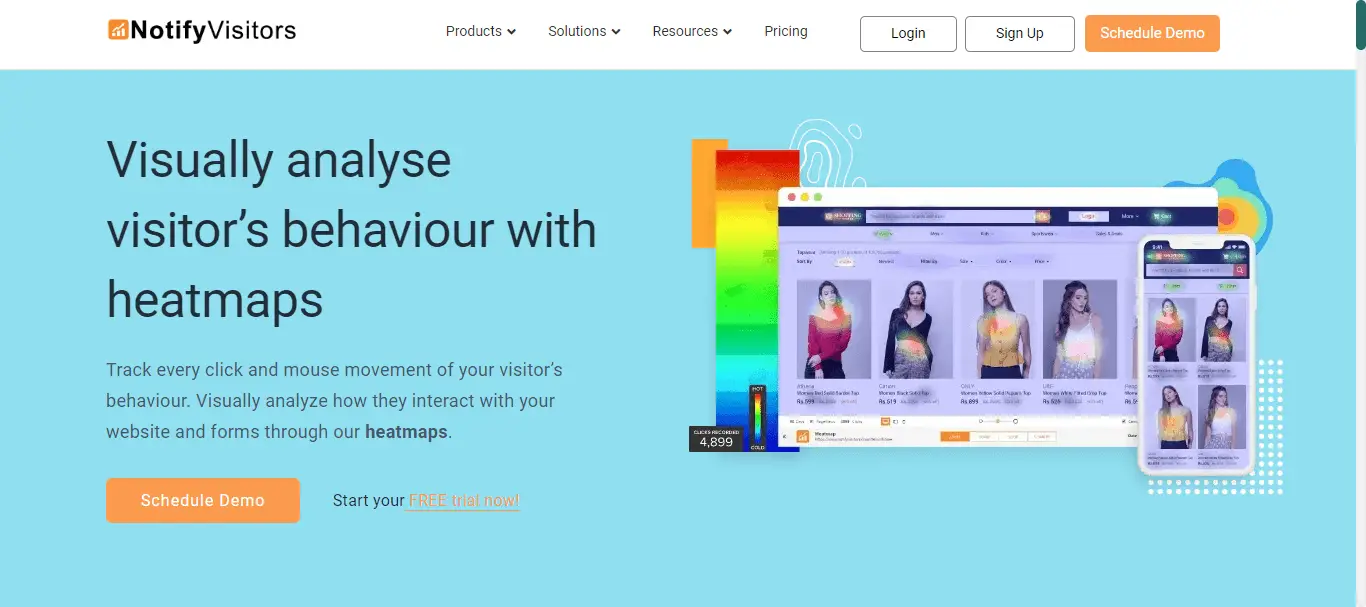
NotifyVisitors Heatmap tool is a powerful tool that empowers businesses to understand user behavior on their websites through visual heatmaps. This tool provides businesses with a clear and comprehensive overview of how users interact with different elements on their website, allowing them to identify areas of high engagement and areas that need improvement. With NotifyVisitors Heatmap, businesses can gain valuable insights into user preferences, enabling them to optimize their website design and content accordingly.
One of the standout features of NotifyVisitors Heatmap tool is its ability to track user clicks, scrolls, and mouse movements. This level of detail helps businesses understand how users navigate through their website and which sections receive the most attention. This information allows businesses to make informed decisions about website layout, placement of important elements, and overall user experience.
Furthermore, NotifyVisitors Heatmap tool offers segmentation options, allowing businesses to analyze user behavior based on different parameters such as traffic sources, user demographics, or device types. This segmentation feature enables businesses to target specific audience segments and tailor their optimization strategies to meet their unique needs.
Overall, the NotifyVisitors Heatmap tool equips businesses with actionable insights to enhance their website performance, improve user experience, and drive conversions.
List of features on the NotifyVisitors heatmap tool
- Click Heatmaps
- Scroll Heatmaps
- Move Heatmaps
- User Session Recordings
- Conversion Funnel Analysis
- Form Analysis
- A/B Testing
- Heatmap Segmentation
- Heatmap Integration
- Heatmap Filters
- User Segmentation Options
- Custom Heatmap Creation Tools
Lucky Orange Heatmap
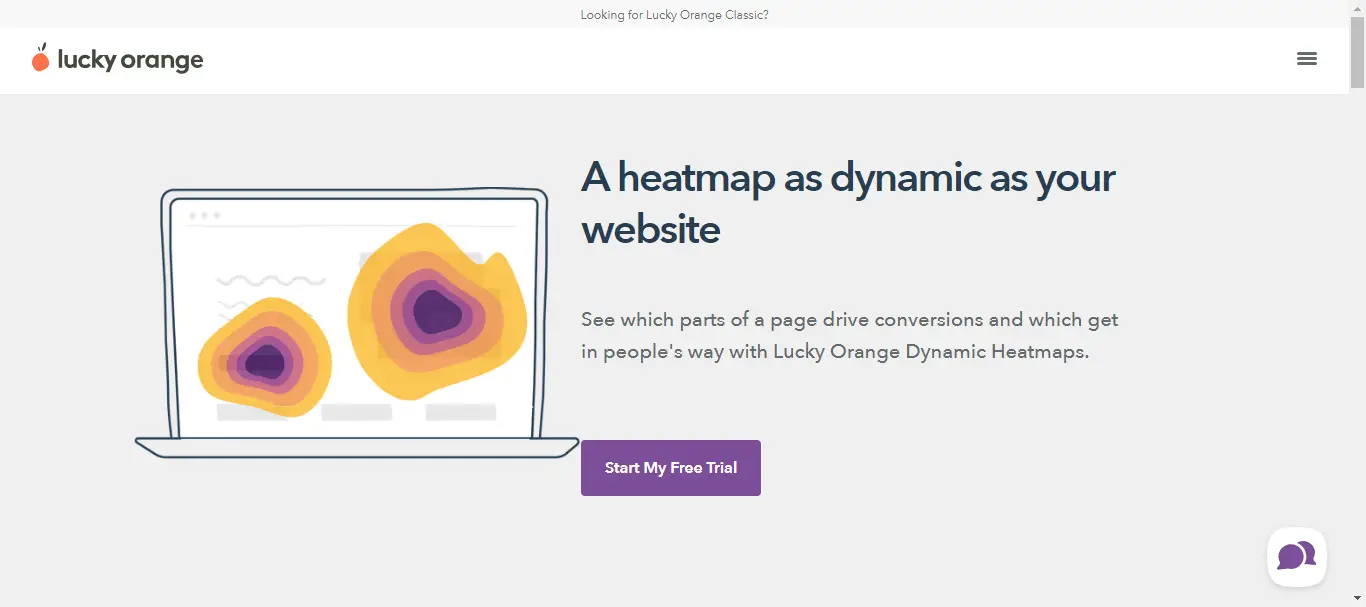
Lucky Orange Heatmap tool is a robust solution that enables businesses to gain valuable insights into user behavior on their websites. This tool provides businesses with visual heatmaps that showcase user interactions, allowing them to identify patterns, trends, and areas of interest for their website visitors. With Lucky Orange Heatmap, businesses can optimize their website design and content to enhance user experience and drive conversions.
One of the standout features of Lucky Orange Heatmap tool is its ability to track and analyze user clicks, scrolls, and mouse movements. This level of detail helps businesses understand how users engage with different elements on their website, which areas receive the most attention, and which parts may need improvement. This information enables businesses to make data-driven decisions about website layout, placement of important elements, and overall user experience.
In addition to heatmaps, Lucky Orange offers additional features such as session recordings and form analytics. Session recordings allow businesses to watch real-time user interactions on their website, providing valuable insights into the user journey and potential pain points. Form analytics, on the other hand, helps businesses track how users interact with their forms, identify form abandonment issues, and optimize their forms for higher conversions.
Overall, Lucky Orange Heatmap tool equips businesses with actionable insights to optimize their website, improve user experience, and achieve their business objectives.
List of features on Lucky Orange heatmap tool
- Click Heatmaps
- Scroll Heatmaps
- Move Heatmaps
- Session Recordings
- Conversion Funnel Analysis
- Form Analysis
- A/B Testing
- Heatmap Segmentation
- Heatmap Integration
- Heatmap Filters
- User Segmentation Options
- Custom Heatmap Creation Tools
- Dynamic heatmaps
- Element analytics
- Optimizable segments
- Announcements
- Dashboard insights
- Visitor profiles
Mouseflow Heatmap
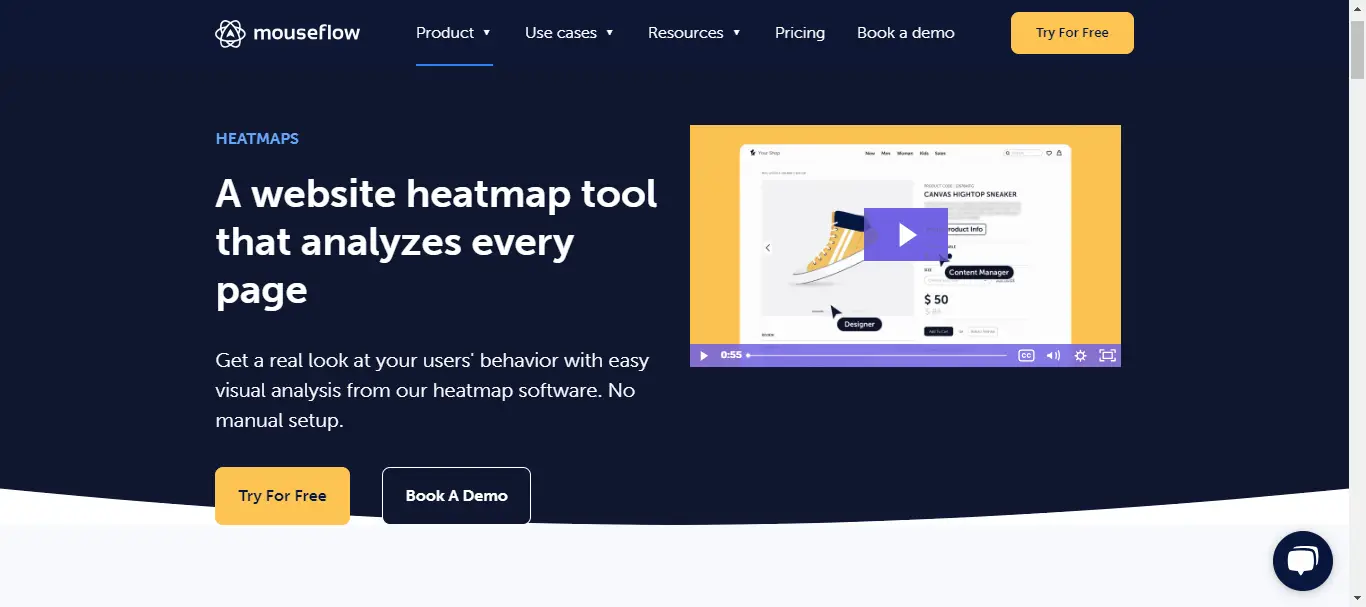
Mouseflow Heatmap tool is an exceptional tool that empowers businesses to gain deep insights into user behavior on their websites. This powerful tool provides businesses with visual heatmaps that display user interactions, enabling them to understand how visitors engage with different elements on their website. With Mouseflow Heatmap, businesses can optimize their website design and content to enhance user experience and drive conversions.
One of the standout features of Mouseflow Heatmap tool is its ability to track and analyze user clicks, scrolls, and mouse movements. This level of detail helps businesses identify areas of high engagement, popular sections, and areas that may need improvement. This information enables businesses to make data-driven decisions about website layout, content placement, and overall user experience.
Mouseflow offers essential features like session replay and conversion funnels. Session replay enables real-time user interaction recordings for understanding user journeys. Conversion funnels track steps users take to complete actions, empowering businesses to optimize paths and boost conversion rates.
Overall, the Mouseflow Heatmap tool equips businesses with actionable insights to optimize their website, enhance user experience, and achieve their business goals.
Here is a List of features on the Mouseflow heatmap tool
- Click Heatmaps
- Scroll Heatmaps:
- Attention Heatmaps
- Movement Heatmaps
- Geographical Heatmaps
- Live Heatmaps
- Session Recordings
- Conversion Funnels
- Form Analysis
- A/B Testing
- User Segmentation
- Integration with Google Analytics
- Custom Dashboard Creation
Inspectlet Heatmap
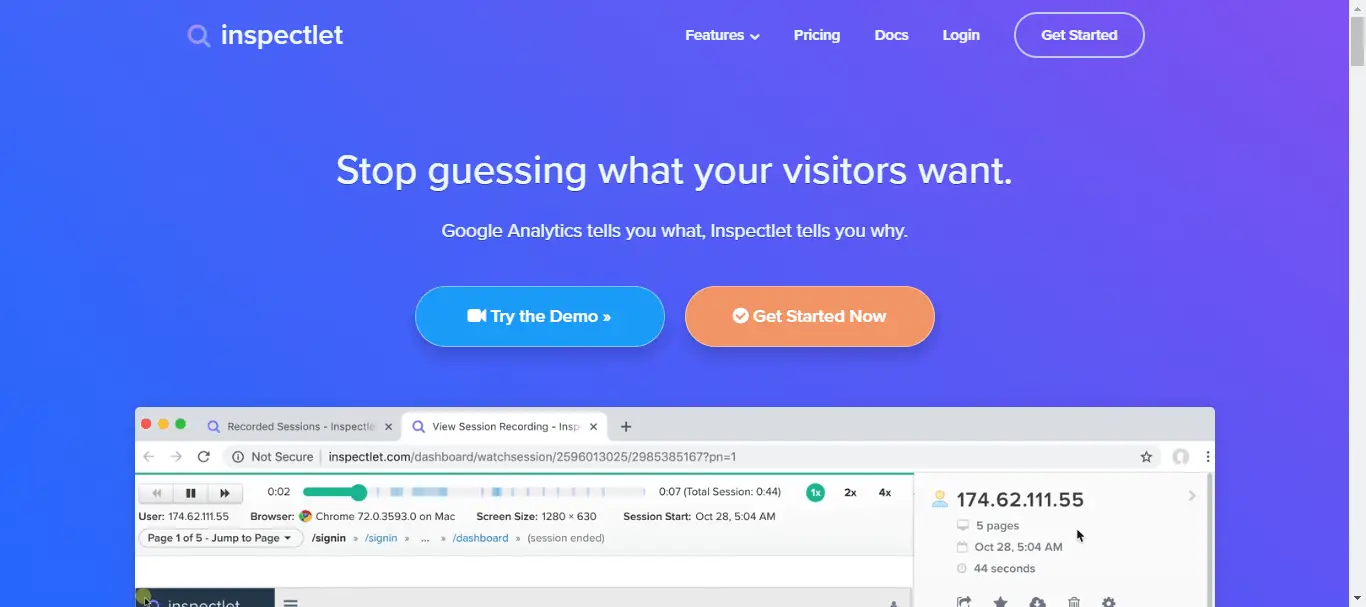
The Inspectlet Heatmap tool is a powerful tool designed to help businesses gain valuable insights into user behavior on their websites. With its intuitive interface and advanced analytics, Inspectlet Heatmap enables businesses to understand how visitors interact with their website's elements, making it easier to optimize design and content for greater user engagement and conversions.
One of the key features of the Inspectlet Heatmap tool is its ability to track and analyze user clicks, scrolls, and mouse movements. By visualizing this data in the form of heatmaps, businesses can identify hotspots of user activity, popular sections, and areas that may require improvement. This information allows businesses to make informed decisions about website layout, content placement, and overall user experience.
Inspectlet also offers additional features such as session recording and form analytics. Session recording allows businesses to watch real-time recordings of user interactions on their website, giving them deeper insights into the user journey and potential pain points. Form analytics, on the other hand, helps businesses track and analyze user behavior specifically related to form submissions, providing valuable information for optimizing lead generation and conversion processes.
In summary, the Inspectlet Heatmap tool provides businesses with the necessary tools to optimize their website's performance, enhance user experience, and achieve their business objectives.
Here is a List of features on the Inspectlet heatmap tool
- Click Heatmaps
- Scroll Heatmaps
- Move Heatmaps
- Attention Heatmaps
- Eye-Tracking Heatmaps
- Session Recordings
- Conversion Funnels
- Form Analysis
- A/B Testing
- Heatmap Segmentation
- Heatmap Integration
- Heatmap Filters
- User Segmentation Options
- Custom Heatmap Creation Tools
VWO Heatmap
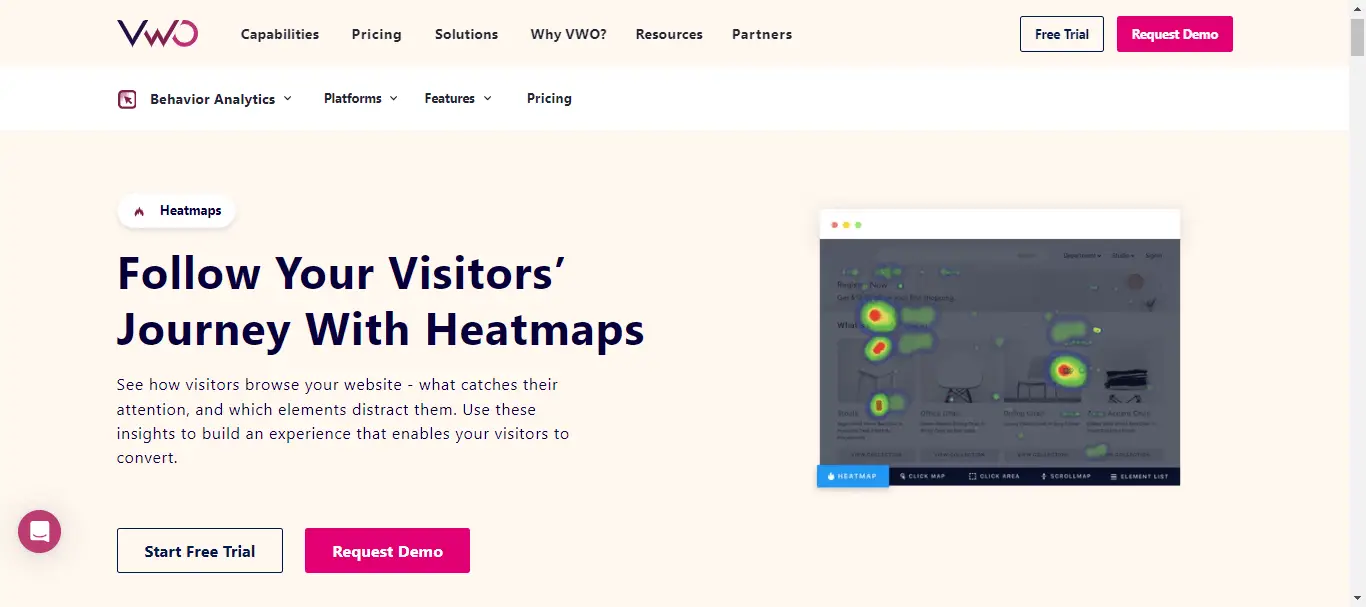
VWO Heatmap tool is a comprehensive tool that enables businesses to gain valuable insights into user behavior on their websites. With its advanced analytics capabilities, VWO Heatmap empowers businesses to understand how visitors interact with different elements on their website, helping them optimize design, content, and user experience for enhanced conversions and customer satisfaction.
One of the standout features of the VWO Heatmap tool is its ability to track and analyze user clicks, scrolls, and mouse movements. By visualizing this data in the form of heatmaps, businesses can identify which elements receive the most attention, areas of high engagement, and potential areas for improvement. This information allows businesses to make data-driven decisions about website layout, content placement, and call-to-action optimization.
VWO also offers additional features such as session recording and conversion funnels. Session recording allows businesses to watch real-time recordings of user interactions on their website, providing deeper insights into the user journey and potential pain points. Conversion funnels, on the other hand, help businesses track and analyze the steps users take to complete a desired action, enabling businesses to optimize their conversion paths and increase conversion rates.
Overall, the VWO Heatmap tool equips businesses with powerful insights to optimize their website, improve user experience, and achieve their business goals.
Here is a List of features on the VWO heatmap tool
- Click Heatmaps
- Scroll Heatmaps
- Move Heatmaps
- Session Recordings
- Conversion Funnels
- Forms Analysis
- A/B Testing
- Heatmap Segmentation
- Heatmap Integration
- Heatmap Filters
- User Segmentation Options
- Custom Heatmap Creation Tools
FigPii Heatmap
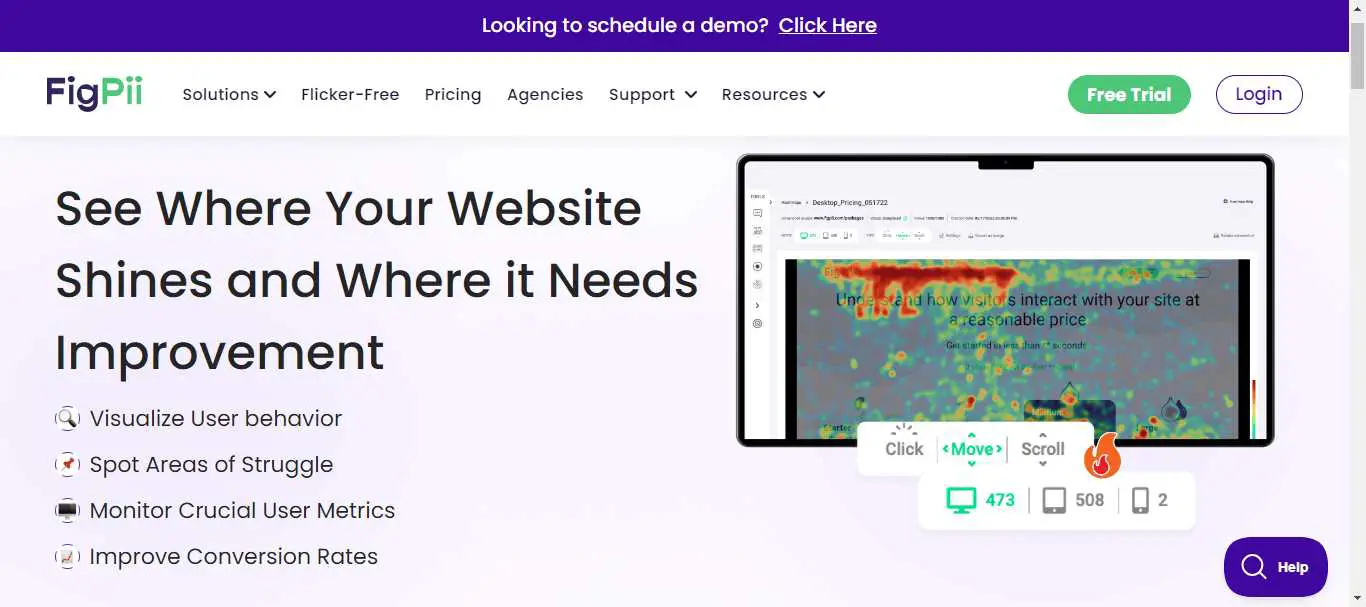
FigPii Heatmap tool is a user-friendly and powerful tool that enables businesses to gain valuable insights into user behavior on their websites. With its intuitive interface and advanced analytics, FigPii Heatmap helps businesses understand how visitors interact with various elements on their website, allowing them to optimize design, content, and user experience for maximum conversions and engagement.
One of the key features of FigPii Heatmap tool is its ability to track and analyze user clicks, scrolls, and mouse movements. By visualizing this data in the form of heatmaps, businesses can easily identify areas of high user activity, popular sections, and potential areas for improvement. This information allows businesses to make informed decisions about website layout, content placement, and overall user experience enhancements.
FigPii also offers additional features such as session recording and A/B testing. Session recording enables businesses to watch real-time recordings of user interactions on their website, providing deeper insights into the user journey and identifying potential pain points. A/B testing allows businesses to experiment with different variations of their website to determine the most effective design and content for optimal user engagement and conversion rates.
In summary, FigPii Heatmap tool provides businesses with the necessary insights to optimize their website's performance, enhance user experience, and achieve their desired business outcomes.
Here is a List of the features on FigPii heatmap tool
- Click Heatmaps
- Scroll Heatmaps
- Mouse Tracking Heatmaps
- Session Recordings
- Conversion Funnels
- Polls & Surveys
- Advanced Targeting
- Session Replay
- Error Tracking
- Custom Heatmap Creation
- Seamless Integration
- Data Filtering and Segmentation
- Visualize User Behavior Patterns
- Optimize Website for Better User Experience
- Continuously Improve User Experience
Browsee Heatmap
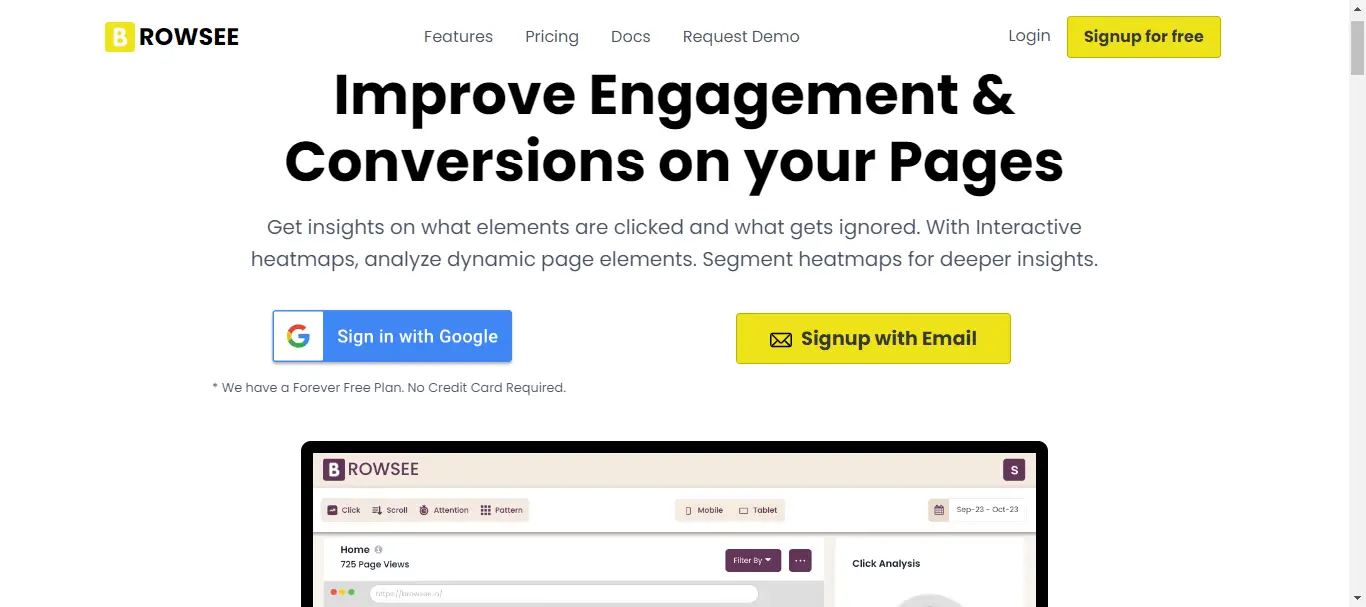
Browsee Heatmap tool is an exceptional tool that offers businesses valuable insights into user behavior on their websites. With its advanced analytics capabilities, Browsee Heatmap empowers businesses to understand how visitors interact with different elements on their website, allowing them to make data-driven decisions for website optimization and improved user experience.
One of the standout features of Browsee Heatmap tool is its ability to track and analyze user clicks, scrolls, and mouse movements. By visualizing this data in the form of heatmaps, businesses can easily identify hotspots, popular sections, and areas of low engagement on their website. This information helps businesses optimize their website layout, content placement, and call-to-action buttons for increased conversions and user satisfaction.
Browsee also provides additional features such as session replay and funnel analysis. Session replay allows businesses to watch recordings of user interactions on their website, providing deeper insights into user behavior and potential pain points. Funnel analysis helps companies to track and analyze the steps users take to complete a desired action, enabling businesses to optimize their conversion paths and improve overall website performance.
In summary, Browsee Heatmap tool equips businesses with powerful insights to optimize their website, enhance user experience, and achieve their business goals.
Here is a List of the features on Browsee heatmap tool
- Click Heatmaps
- Scroll Heatmaps
- Attention Maps
- Move Heatmaps
- Click Snapshots
- Session Recordings
- Conversion Funnel Analysis
- Form Analysis
- A/B Testing
- User Segmentation
- Heatmap Integration
- Heatmap Filters
- Custom Heatmap Creation
- Data Visualization and Reporting
- Customizable Dashboards
Conclusion
The availability of various heatmap tools empowers businesses to gain valuable insights into user behavior and make data-driven decisions. These tools offer a visual representation of user interactions on websites, allowing businesses to identify areas of improvement, optimize conversions, and enhance user experiences. The options are abundant whether it's heatmaps for click tracking, scroll tracking, or mouse movement tracking.
From popular tools like Hotjar and Crazy Egg to specialized solutions like Mouseflow and Lucky Orange, businesses have a wide array of heatmap tools to choose from based on their specific needs and budget. With these powerful tools, businesses can unlock the potential to enhance their website performance and achieve their goals.


